About Expertise
We transform data into visuals that improve clarity and accelerate decision-making. Dashboards, charts and models turn analysis into action.

Visual Dashboards for Mobility
We build tools that make transportation trends easy to understand and act on.
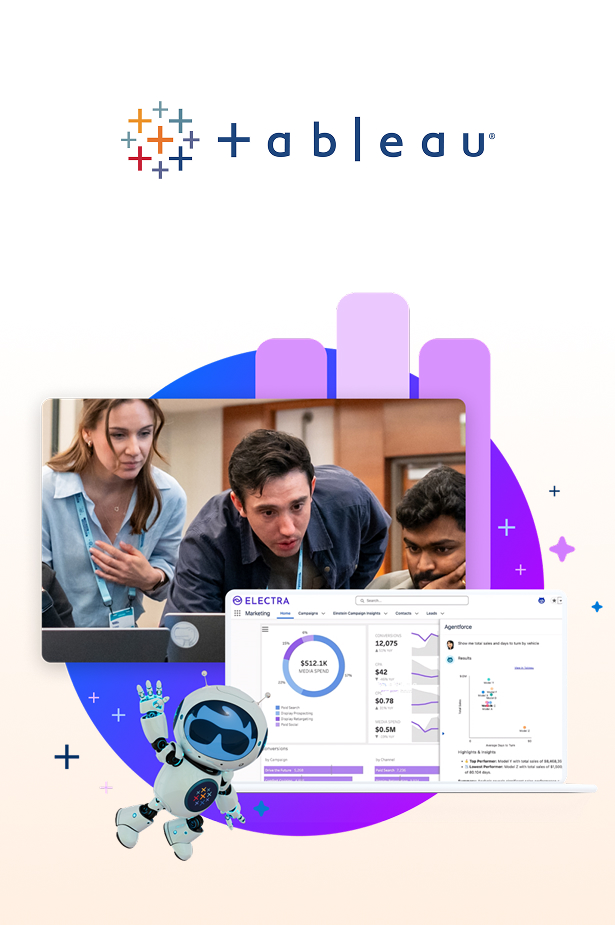
We use Tableau, Power BI and custom solutions to visualize KPIs, maps and time series data. Our dashboards help planners and policymakers monitor performance and track progress. The result is faster, more informed decision-making.
Storytelling Through Analytics
We turn raw data into narratives that resonate with stakeholders and the public.
We create infographics, report cards and data summaries that support outreach and collaboration. Our visual storytelling builds transparency, drives engagement and supports funding and policy success.

Let's Work Together
We help you deliver the best solutions for your company and projects.


